Q.1 Plot the points A(4,-3) and B(-2, 5), join them and find the equation of the line. Write all the steps.
1. Open Geogebra. Make sure that the Co-ordinate Axes and the Grid is displayed.
2. Click on Tool No 2, and Select ‘New Point Tool’. See Figure 1
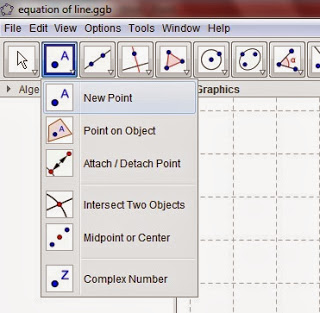
Figure 1
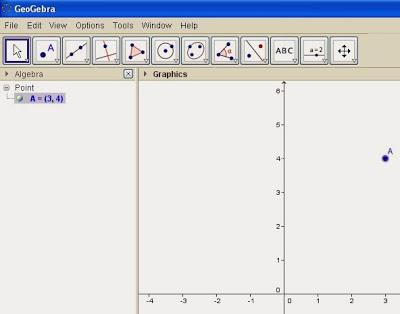
3. Click on the point (4, -3). A new point A will be plotted as shown. See Figure 2
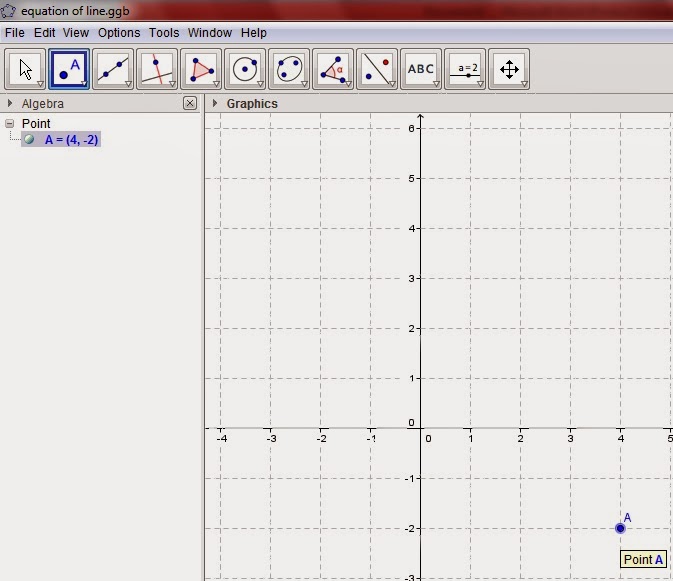
Figure 2
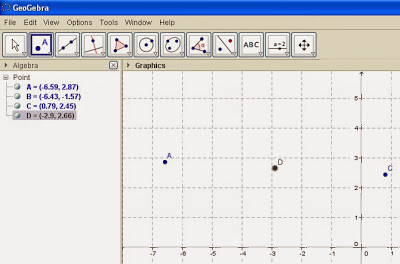
4. Click on the point (-2, 5). A new point B will be plotted as shown. See Figure 3
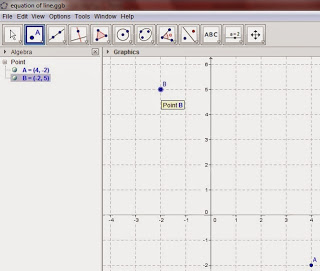
Figure 3
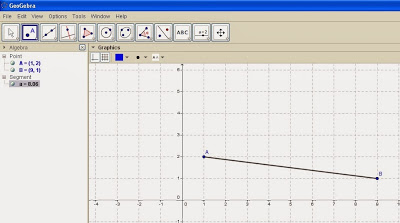
5. Click on Tool No 3 and select ‘Line between 2 points Tool’. See Figure 4
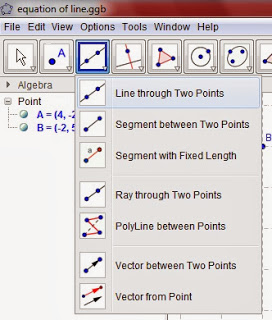
Figure 4
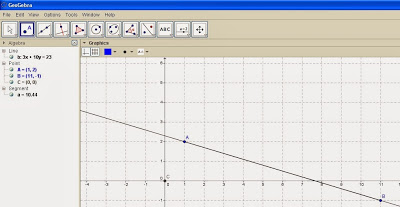
6. Click on point A followed by point B. A line will be drawn through points A and B and the equation of this line will be displayed in the Algebra section of the display.
7. Save your file or print it if required. See Figure 5
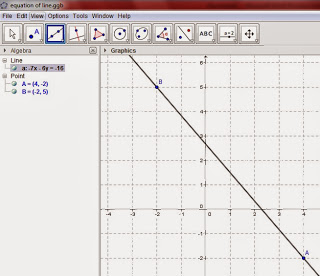
Figure 5
Q.2 Give names of the different parts of the Geogebra screen.
OR
Describe the Geogebra Window.
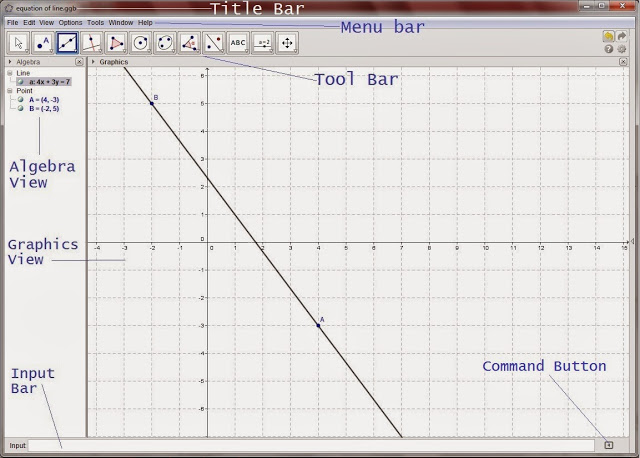
Figure: The Geogebra Window.
The parts of the Geogebra Window are as follows.
Title Bar: The title bar runs across the top of the Geogebra Window. It displays the name of the file being worked upon.
Menu Bar: It is located just below the Title Bar. All commands and sub Commands can be accessed from here. Its main commands are File, Edit, View, Options, Tools, Window and Help.
Tool Bar: Just below the menu bar of the Geogebra Window comes the Tool Bar. 11 Main Tools are available in the Tool Bar. Clicking on the small down arrow at the right hand bottom of the tool will display several options, and thus many more tools can be selected.
Algebra View: The Algebra view is displayed on the left pane of the Geogebra Window. It gives the algebraic representation of objects created in the Graphics View or by inputting commands typed in the Input Bar.
Graphics View: This is the main part of the Geogebra Window. Using the graphics view we can construct and display points, angles, lines, segments, circles and other geometrical figures. The X and Y axes and also a grid can be displayed.
Input Bar: The Input Bar runs across the bottom of the Geogebra Window. Algebraic Inputs such as co-ordinates of points, equations of lines, angles as well as many commands can be entered directly into the Input Bar. On the right hand side of the Input Bar is the Command Button. Clicking on the Command Button will display all the commands that can be entered in the Input Bar and also their syntax.
3) What would you use to type the equation for drawing a graph in Geogebra?
OR
What is the use of the Input Box in Geogebra?
Using the input box at the bottom of the Geogebra Screen we can enter different objects on the Graphics area of the Geogebra Window. Points, lines, circles, segments, midpoints of segments, Polygons etc., can be easily drawn in the Geogebra Window.
The usual operators used in Computers are still applicable. ‘+’ for Addition, ‘-‘ for Subtraction ‘*’ for multiplication and ‘/' for division ‘^’ for exponentiation.
Multiplication can also be done by the following methods. E.g., 2*x is same as 2x and is same as 2 x.
The Algebraic representation of the Command will be displayed in the Algebra Section.
Examples of Commands (Give any two examples for a two mark Question)
Command
Use of the command
Output
A=(3,4)
Plots a point A (3,4) on the Geogebra Window.
Segment[A, B]
Draws a segment between points A and B.
The Points A and B must be previously defined.
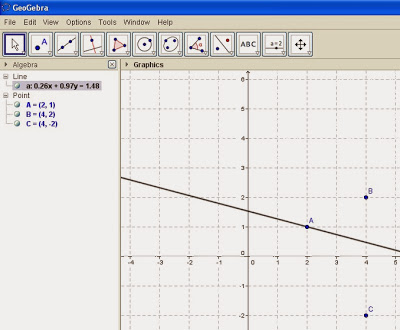
Line[A, B]
Draws a line passing through the points A and B.
The equation of the line will be displayed in the Algebra section.
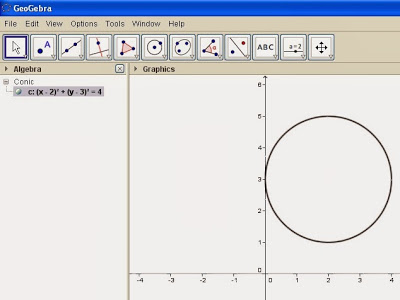
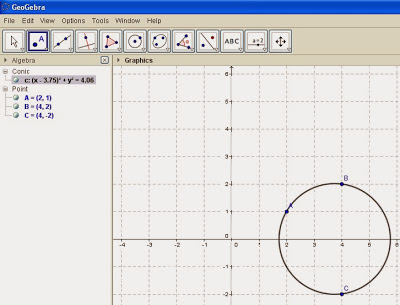
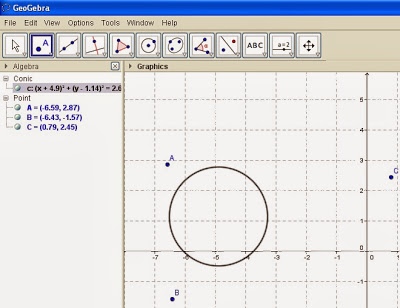
Circle[(2,3), 2]
Draws a circle with center at point (2,3) and Radius 2
Displays the equation of the circle as
c: (x - 2)² + (y - 3)² = 4
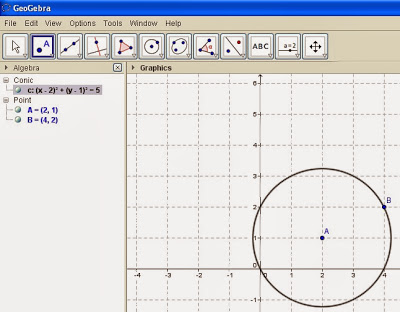
Circle[A, AB]
Draws a Circle with center at the point A and with Radius equal to length of Segment AB.
The equation is displayed in the Algebra Section
Circle[C, AB]
Draws a Circle with center at the point C and with Radius equal to Segment AB.
The equation is displayed in the Algebra Section
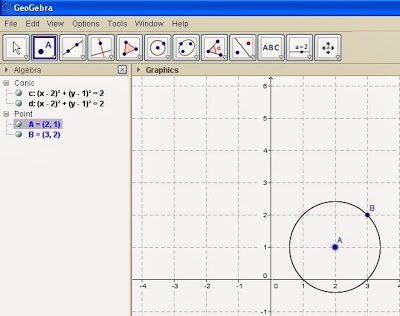
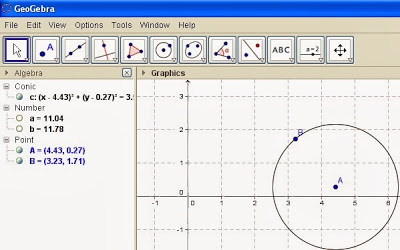
Circle[A, B]
Draws a Circle with Center at A and with a point B on the Circle. (AB is the radius)
The equation is displayed in the Algebra Section
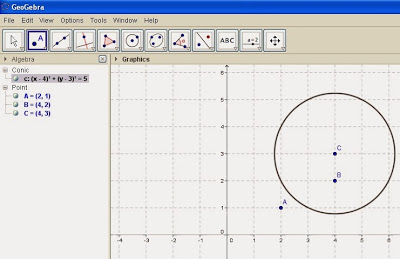
Circle[A, B, C]
Draws a Circle passing through the points A, B and C.
The equation is displayed in the Algebra Section.
AngleBisector[B, A,C]
Draws a Line Bisecting the angle formed by the three points B, A and C.
The equation is displayed in the Algebra Section.
Area[A, B, C]
Finds the area of the Triangle having vertices A, B and C.
The answer is displayed in the Algebra Section under Number.
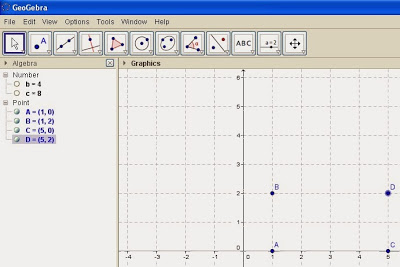
Area[A, B, D, C]
Finds the area of the Rectangle (Polygon) having vertices A, B, D and C.
The answer is displayed in the Algebra Section under Number.
Area[c]
Displays the area of the circle (c) in the number Section.
Circumference [c]
Displays the circumference of the Circle (c) under Number Section.
Incircle[A, B, C]
Draws the Incircle of the triangle having vertices A, B and C.
Midpoint [A, C]
Displays the midpoint between the points A and C.