1. Open Geogebra. From the ‘Options’ Menu click ‘Advanced.’
Select ‘Preferences -- Graphic’.
See Figure 1.
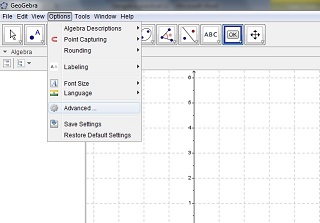
Figure 1
2. Click on x-axis Tab and click on Label. Enter 'Age' as label.
See Figure 2.
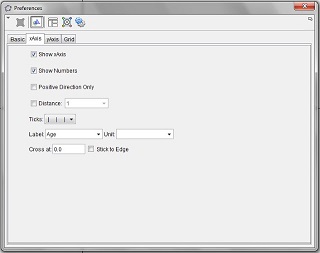
Figure 2
3. Click on Y-axis Tab and click on Label. Enter ‘Percentage’ as label. See Figure 3.
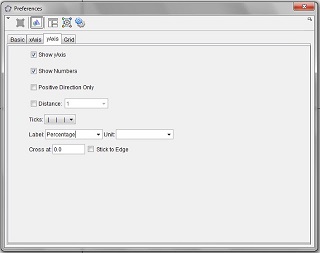
Figure 3
4. Click on Grid tab. Select show Grid. Enter grid distance as ‘2.5’ for x-Axis.
See Figure 4.
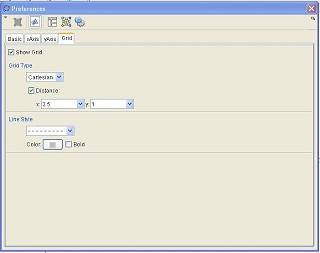
Figure 4
5. In the Input Box at the bottom of the Screen type, histogram[{15,20,25,30,35,40,45}, {42,38,35,26,16,5}] Press Enter. The required Histogram will be displayed. Use the Mouse Scroll button and the Move Graphics View Tool from Tool 11 to position the graphics area properly.
See Figure 5.
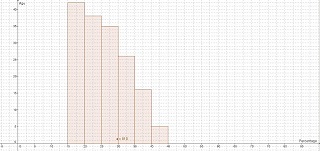
Figure 5
6. In the command box at the bottom of the Geogebra window type FrequencyPolygon[{15,20,25,30,35,40,45}, {42,38,35,26,16,5}].
The Frequency Polygon along with the Histogram will be displayed. See Figure 6 Save or Print your file as required.
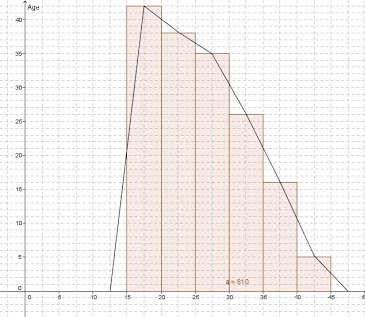
Figure 6